|
|
Quick Start | PopChart Quick Start 4.0.5 |
In a world of ever increasing information, perhaps no skill is more valuable than the ability to convey that information in the most understandable and accessible format possible. Raw data is no exception to this rule. Yet, because understanding raw data often involves wading through spreadsheet after spreadsheet in search of key figures and trends, it is often the hardest type of information to convey.
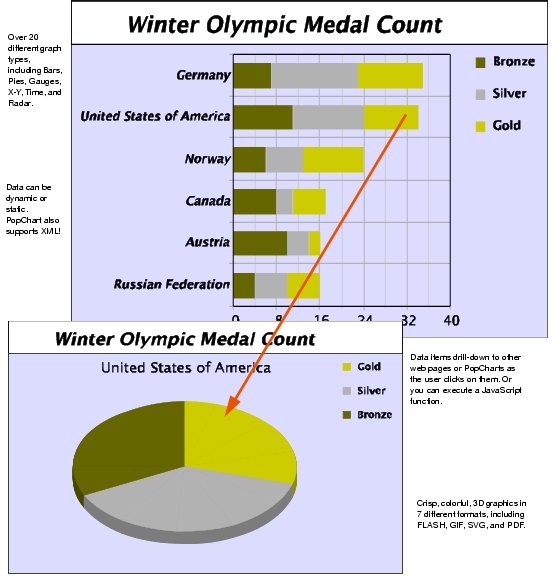
For that reason, data visualization is paramount. Graphs and charts can convey in a few seconds information that is often not clear even after hours of analyzing numbers. Data visualization is what Corda Technologies is all about. With our easy-to-use PopChart tools, you can translate your data into state-of-the-art PopChart images—eye-catching, high-resolution, and interactive data-driven graphics, such as the ones on the next page.

A PopChart image can contain a variety of charts and graphs, fed with on-demand dynamic data. It can include explanatory text boxes, callout notes, or PopUp text that appears as a viewer rolls over certain parts of the graph. It can even include interactive drill-down effects, such as linking to another PopChart image as a user clicks on a certain data item, or executing your own custom JavaScript functions.
As you read through this documentation, you will learn all about how you can utilize PopChart technology to convey your information. And, if you haven't already, you will soon discover why PopChart is your all-purpose data visualization tool.
PopChart Server does exactly what its name implies—that is, it serves images of charts and graphs. But these aren't just run-of-the-mill static charts and graphs. These are dynamic and interactive images generated by PopChart Server on the fly.
It works like this. You create an appearance file (kind of like a template for a graph) with PopChart Builder. Then, you send this appearance file to PopChart Server, along with data and formatting options, and PopChart Server returns a PopChart image—a graphical representation of your data, complete with PopUp text and the ability to drill-down to another graph that explains a data item in greater detail.
The image can be in one of many different types of formats, including Macromedia® FLASH, SVG, PNG, GIF, PDF, EPS, WBMP, and even d link descriptive text for the visually impaired. You can also interface natively with PopChart Server in a variety of environments, from simple HTML to ColdFusion; from Java Application Servers to Microsoft®'s .NET framework. PopChart Server can accept data from most database and data file formats. It even supports XML, making PopChart Server easy to integrate with your existing database system.
PopChart Server is the fastest, most robust, and most versatile data visualization and charting tool on the market today. Best of all, because PopChart Server is written in 100% Java, it can run on any platform. No matter what environment you operate in, you can take advantage of PopChart Server's patented DataFunnel technology to deploy the latest in state-of-the-art interactive data-driven graphics.
PopChart Server can be downloaded for evaluation or purchased from the Corda Technologies website at http://www.corda.com.
PopChart Builder is a graphical design tool that helps you design appearance files (templates) for use with PopChart Server. This easy-to-use development tool is purchased separately from PopChart Server, as many companies have multiple developers creating appearance files, but only one or two servers.
PopChart Builder can be downloaded for evaluation or purchased from the Corda Technologies website at http://www.corda.com.