|
|
Data Organization | PopChart Server Reference 4.0.5 |
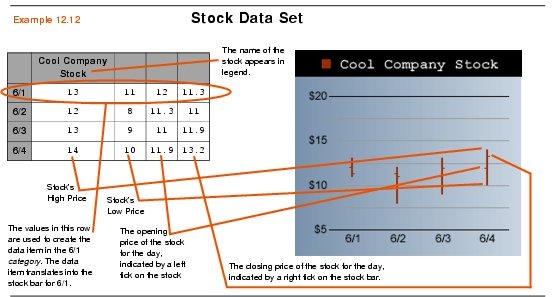
When organizing a Stock data set in a spreadsheet format, the cell in second column of the first row of the spreadsheet will be used for the series name. Any other cells in the first row will be ignored. All remaining rows will be interpreted as categories (not series, as you would expect in other data classes). Since there is only one series of data, you could also say that each row represents an individual data item.
The first column of the spreadsheet contains category names. The second column represents the high value for each data item. The third column represents the low value, the fourth column represents the open value, and the fifth column represents the close value. These last two columns are optional, and will be invisible if you are just displaying a High-Low graph.
The spreadsheet in Example 12.12 displays a typical data set for a graph that uses the Stock data class.
