|
|
Graph Types | PopChart Server Reference 4.0.5 |
Listed below are the Gauge subtypes.
The gauge depicted in Example 13.15 is a Filled Bar Gauge. It uses a colored bar to indicate size of the data value. The bar is divided into different colored segments representing each color range. The data value is in the range indicated by the color of the last colored segment of the bar.
To create a Filled Bar Gauge in PopChart XML, you should set the SubType attribute of Graph to Filled Bar. The tag below shows how this is done.
<Graph Name='graph' Type='Gauge' SubType='Filled Bar'>
LED Bar Gauges look exactly like a Filled Bar Gauge, except the colored part of the bar is ridged or perforated so that it looks like an LED display. The image below shows an LED Bar Gauge.

To Create an LED Bar Gauge in PopChart XML, you should set the SubType attribute of Graph to LED Bar. The tag below shows how this is done.
<Graph Name='graph' Type='Gauge' SubType='LED Bar'>
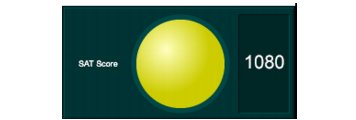
A 3D Bulb Gauge consists of a single three-dimensional bulb that is shaded in the color of of the range that the data value is in. It can also display a data value and a gauge label. The image below shows a 3D Bulb gauge

To create a 3D Bulb Gauge in PopChart XML, you should set the SubType attribute of Graph to 3D Bulb. The tag below shows how this is done.
<Graph Name='graph' Type='Gauge' SubType='3D Bulb'>
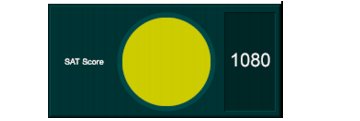
A regular Bulb Gauge is exactly like a 3D Bulb Gauge, except it is two dimensional. The image below shows a regular Bulb Gauge.

To create a Bulb Gauge in PopChart XML, you should set the SubType attribute of Graph to Bulb. The tag below shows how this is done.