|
|
Configuring Your Server | PopChart Server User Guide 4.0.5 |
PopChart Server provides two ways of monitoring server transactions: the server log, and console output. This section will help you configure and use these features.
This is an internal log that stores information about PopChart Server's most recent transactions. If enabled, you can view it at the bottom of the Server > Statistics screen in the Administration Console.
1. Login to the Administration Console.
If you do not know how to do this, refer to "Using the Administration Console" on page 3-2.
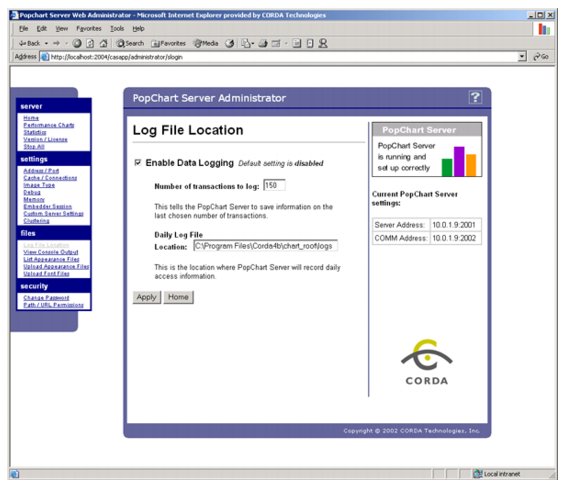
2. Using the menu on the left, go to the Files > Log File Location screen.

3. Check the Enable Data Logging box.
4. In the Number of transactions to log box, enter the number of recent transactions you want PopChart Server to keep in its log.
For example, if you enter 150, PopChart Server will keep information about the last 150 requests it received.
5. Click Apply to save your changes.
If you do not know how to do this, refer to "Stopping, Starting, and Restarting PopChart Server" on page 3-11.
This is what you would see if you were running PopChart Server from the command line (such as when you run the PopChart Server with Console icon). It shows you real-time console messages from PopChart Server. It will keep track of all messages since the Administration Console was last stopped.
1. Login to the Administration Console.
If you do not know how to do this, refer to "Using the Administration Console" on page 3-2.
2. Using the menu on the left, go to the Files > View Console Output screen.

By default, PopChart Server will output very little information to the console. If you enable debug mode, however,PopChart Server can send detailed messages to the console for every image it generates, including the file format and the amount of time it took to generate the image. It can also dump every request it receives to the console.
1. Login to the Administration Console.
If you do not know how to do this, refer to "Using the Administration Console" on page 3-2.
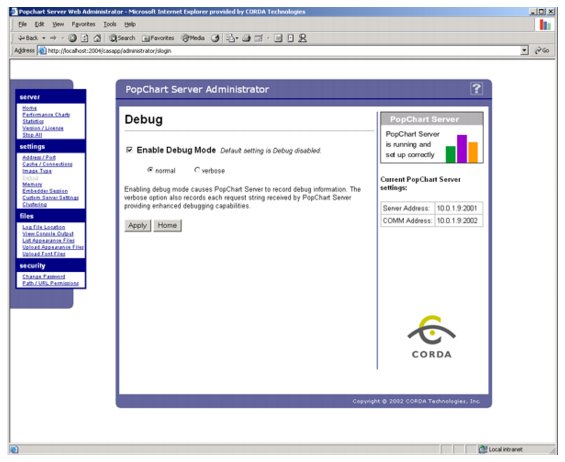
2. Using the menu on the left, go to the Settings > Debug screen.

3. Check the Enable Debug Mode box.
4. Select a debug setting by selecting either the Normal or Verbose radio button.
The Normal setting will output detailed information about each image that PopChart Server generates. The Verbose setting will do this, as well as dump each request that PopChart Server receives over the server and comm ports to the console.
5. Click Apply to save your changes.
If you do not know how to do this, refer to "Stopping, Starting, and Restarting PopChart Server" on page 3-11.
Warning: Do not run PopChart Server in debug mode, especially under the verbose setting, for extended periods of time. Besides consuming additional resources, debug output will create a very large temporary file to store the console output.